Workshop Types
Contents of this page:
See also Workshop techniques and Agile Techniques and Consulting Principles.
Misc
All types of workshop
- Five whys
- aka root cause analysis
- Miro created at XP Manchester in an attempt to use the Five Whys technique to determine why XP isn’t more widely adopted.
- Futurespective
- Lean Value Tree
- Empathy mapping
- Stakeholder empathy mapping
- Event storming
- Service mapping
- Wardley mapping:
- User journey / story mapping
- The Cynefin Framework
- Elevator pitch
- Trade-off sliders
- Hypothesis Workshops - see notes below
- Inverse Conway Manoeuvre - see notes below
- CRC cards
- blank (“naked”) CRC cards
- Value proposition map / value proposition design
- Real example here (Clare only)
- Blank example here
- Over on the far right you list the things you want to achieve (“jobs to be done”)
- In the same section, you list gains that users might get
- Under that list things that are currently painful for users
- On the far left, list features / services in your solution
- Also list ways in which gains might be achieved (“gain creators)
- Also list ways in which pains might be alleviated (“pain relievers”)
- Now you want to cross-reference
- (? I’m not 100% sure I’#ve got this bit right - need to check)
- for each job, check that it has an associated service / feature
- for each gain, check that it has an associated gain creator
- for each pain, check that it has an associated pain reliever
- for each feature / service, check that it has an associated gain creator or pain reliever
- Data mapping
- Real example here(clare only)
- get people to start by adding postits for sources and destinations of data
- then add lines to indicate how data moves from one place to another
- As-is and to-be user journey mapping
- Real examples here and here (clare only)
- As-is:
- put the ultimate goal over on the right
- add post-its to represent steps along the way
- have a line underneath that represents whether each step makes happier or sadder
- Pink post-its underneath document pain points
- Blue post-its above document possible quick wins that will improve things for the user
- To-be:
- Now do the same again but for the suggested improvement journey (or to represent a brand new journey)
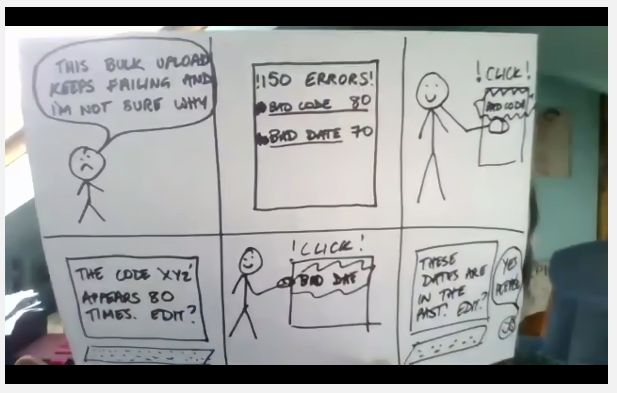
- Storyboarding
- Real example in this repo
- Fold paper to create 8 panels, then use them to create a ocmic strip that describes a blue-sky imagined new or improved user journey.
- Action Learning
- Lots of consultancy examples
- (available to Clare only): Until I’ve processed them, just need to look in this folder and trawl through the presentations: OneDrive\T..\Cl…\Pi…
- Leadership style
- based on Kylie Yearsley’s workshop at AOTB21. See below.
Specific types of workshop in more detail
Value Stream Mapping
- Value Stream Mapping
- Good podcast about this from Codurance here
- you need a lot of horizonal width but not a lot of height
- so, a long wall and a long whiteboard or long roll of paper
- Typically you will end up with something that looks like castellations on a castle wall
- You’re starting on the left with conception and finishing on the right with the point at which value is released to your users
- You mark all events in your process
- Basically map the stages in your workflow, particularly those with handovers
- You note how long things sit still while waiting for things to happen
- You note points at which value is added
- The process allows you to identify
- cycle time (how long it takes to process one item (or one sprint?)),
- lead time (how long it takes from concept to delivery of value),
- wait time (how long things sit waiting),
- If you add cycle time plus wait time you will get lead time.
- queue size (how many things sit waiting),
- waste (eg when things go backwards instead of forwards because they are sent back by QAs for bug fixing),
- bottlenecks (places where everything slows down while they go through a slow process - eg if you only have one QA).
- You are only as fast as your slowest bottleneck.
- Kanban boards are useful for visualising queues.
- The theory of constraints talks about things like bottlenecks and how they prevent you from releasing value effectively.
- The goal is to create Flow by optimising the system. The map has no value on its own except as a tool.
- Start with information flow on the top. How does demand come in, who is in charge of that
- Sometimes it’s helpful to start at the end because people find it easier to agree on the end than the start
- even if you don’t, when you’re done run through it again from the end
- Going from the end helps people to see it as pull based rather than push based
- Get everyone involved
- Explain what you’re doing before you start
- Often the first session results in working out what data points you don’t have, then going away and adding in some monitoring so that you can come back with the data you need to compete the exercise
- Don’t solutionise until the end, than work on the bottleneck
- There will only be one bottle neck (there may be several places where things slow down, but whichever is the slowest becomes the bottleneck)
- At this point you can do root cause analysis / five whys to identify the cause of the bottleneck
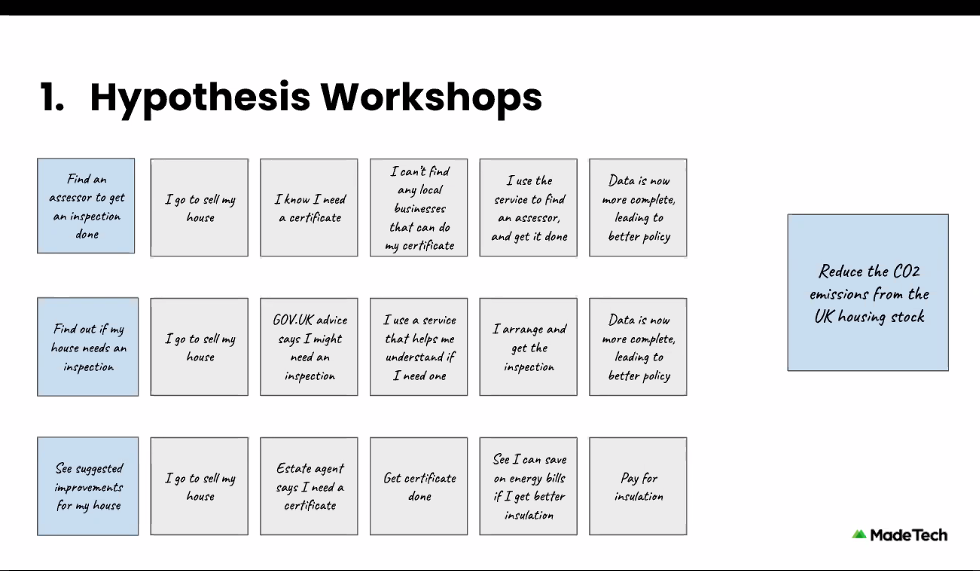
Hypothesis workshops
Notes from Tito’s Made Tech talk August 2020 (see also screenshots below):
- in the context of replacing legacy - the point is that you are revisiting the things your system already does, and asking how probable is it that users will even need some of that stuff
- The whole team should be involved
- What is the point of the thing that you are building
- Put goals on the right - ideally 1 - no more than three - if more split into separate workshops
- put features on the left
- write postits between left and right that will lead from the thing on the left to the thing on the right - see image
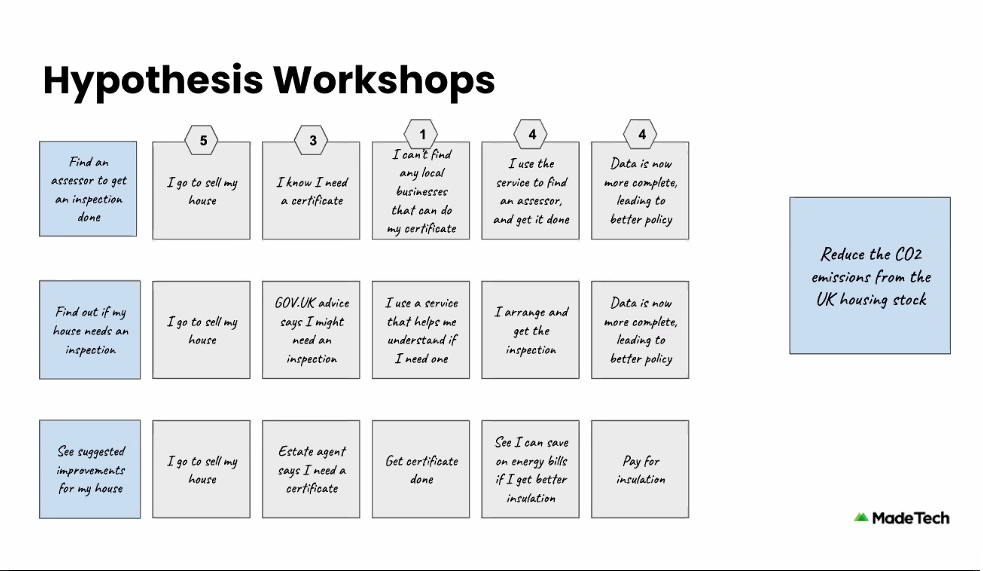
- add numbers saying how likely it is that this will happen - see image
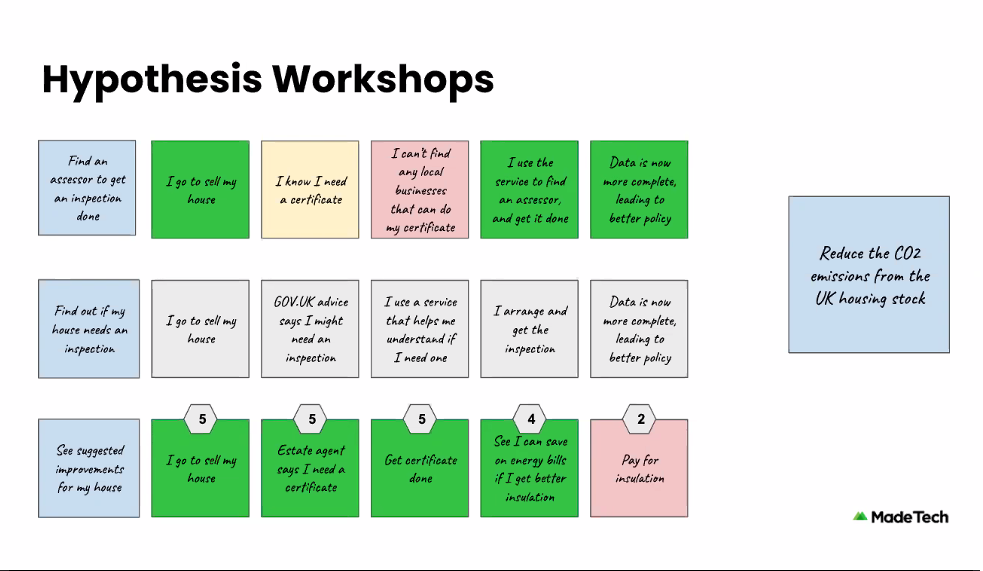
- add colours to show priority - see image.
- you have to take risks and this enables you to visualise / understand the risk of investment vs return
- in the context of replacing legacy - the point is that you are revisiting the things your system already does, and asking how probable is it that users will even need some of that stuff
- every event assumes that every event to the left of it is true
- you can then prioritise what to focus on based on how likely it is that all the events will happen that you need in order to reach your goal
- for instance, MHCLG energy certificates, finding a certificate provider, it’s unlikely people won’t find one by just using google,
- so there’s little point putting tons of effort into improving or reimplementing this legacy product
- then your hypothesis is that nobody will use this product so don’t implement it
- or it’s highly likely that you’ll reach your goal by improving / reimplementing this thing, therefore go for it
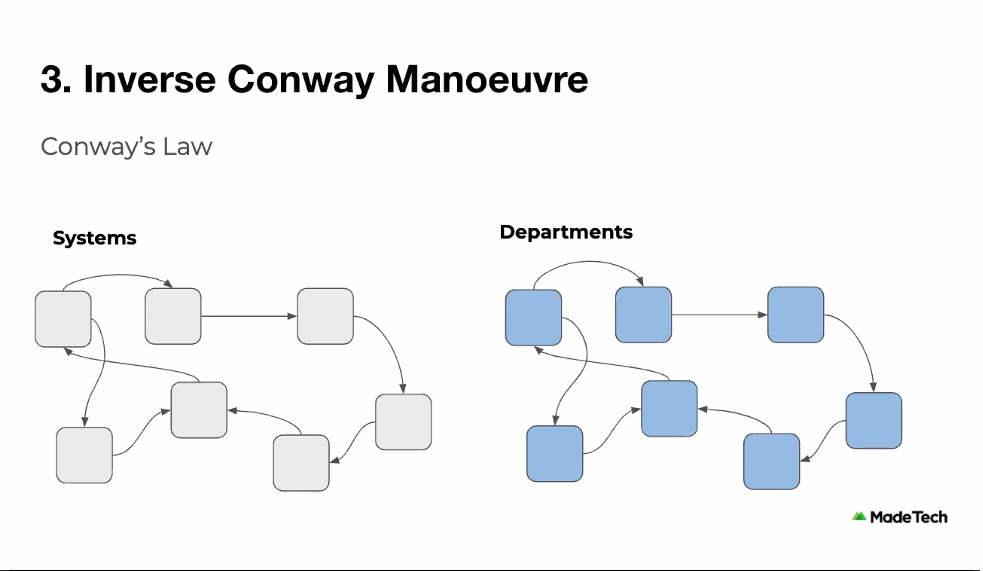
Inverse Conway Manoeuvre
Notes from Tito’s Made Tech talk August 2020 (see also screenshots below):
- Your software systems / components will likely match your org structure
- Don’t fight conway’s law - don’t reoganise your products in a way that won’t match your teans
- the new structure becomes an emergent pattern of your architecture
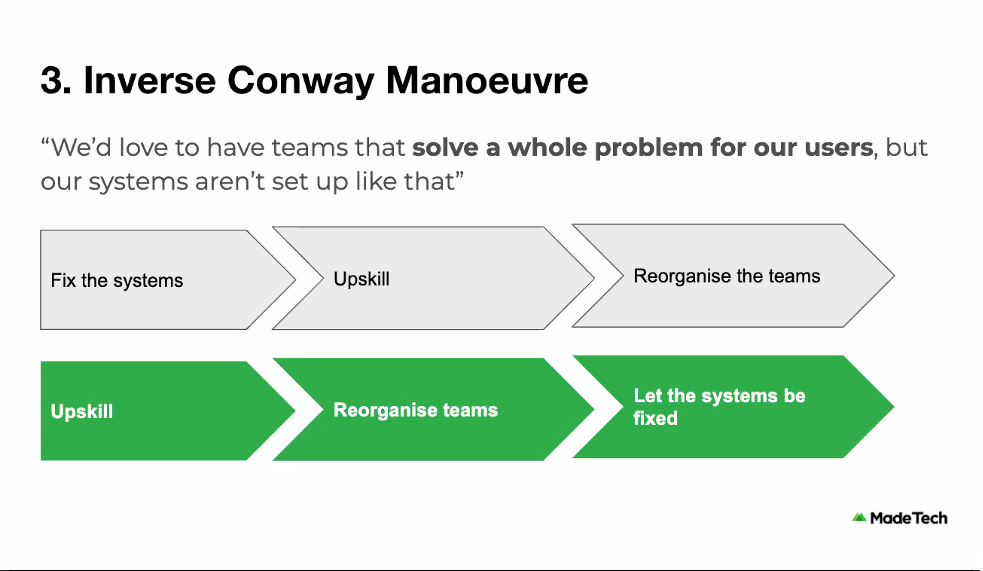
- but don’t expect it to work like magic
- you need strong leaders to manage the fact that there will be a temp velocity slowdown and a bit of chaos
Measures of Success
Role Definition
- Claire W ran one of these for me and a resident tech lead at Samba. The outcome postits are available (to Clare only) at OneDrive\TW-Stuff\Clients[Samba]]\ClaireW-TechLeadPics-small
- The structure included the following:
- Does/Doesn’t: Use post-its to define what is and isn’t part of the role
- Value/Effort quadrants: Use quadrants to prioritise the does/doesn’t
- Looking forward (this was done when looking at a role that was already being done, so may not all be needed at the start of a role):
- Identify key deliverables / objectives and vote on them to decide a priority
- Identify what support and resources you are already receiving
- Identify what support and resources you are NOT receiving but do need
- Identify what support and resources you are currently receiving but do NOT need
- As you go, identify Actions (and as ever, use a parking lot for things you don’t have time to address now)
Writing the Minister’s Speech
These are notes from a talk by Randy Silver at UK GovCamp21.
- Miro: https://miro.com/app/board/o9J_lXiMgRk=/
- Comes from Amazon’s “Write the future press release” exercise
- Imagine what the future press release (or in this case, the minister’s speech) will look like if you succeed in your aims
- Four aims
- What were we trying to achieve (state your goal)
- Who was it for
- Set an audacious and clear goal
- How did we set out to achieve it together - outline the principles that led to success
Dragon Mapping
These are notes from a talk by Randy Silver at UK GovCamp21.
- assumptions can become opinion, which is hard to counter
- assumptions can be countrered with facts, but opinions are harder
- it’s a way of laying everything out without being directly confrontational
- based on assumptions mapping, impact mapping, the opportunity solution tree and the five whys (root cause analysis)
- they are all good, but hard to use with stakeholders because they can’t be explained in 5 mins
- miro board: https://miro.com/app/board/o9J_lXiMgRk=/
- step 1: list your goals
- step 2: Answer the question “for this to happen, what must be true?”
- step 3: keep going, drilling down in tree-like fashion
- step 4: Label everything as either fact or assumption
- eg I want to sell cookies
- what must be true?
- people like my cookies
- people can visit me
- people can pay
- these are all assumptions - they are the dragons. Find some way to highlight them.
- what must be true?
- step 5:
- talk about how you can test / prove your assumptions - prioritise these for experiment
- your strategy should be built on the absolute minimum of dragons
- or your short term roadmap might be built on killing dragons - ie proving your assumptions
Leadership Style
- This is based on the workshop run by Kylie yearsley at Agile on the Beach 2021
- in teams (need at least two teams):
- start with a list of leaders from fiction, film, real world. Don’t have to be “good.” One leader per postit, in a vertical line.
- then in a horizontal line from each leader, their leadership attributes
- one attribute per postit.
- number the leaders.
- remove the leaders.
- switch the teams around (so each team is looking at another team’s postits)
- now write the names of team members in a horizontal line to create headings off to one side of original postits
- individual introspective exercise:
- in a vertical line coming down from your name, write a score out of 10 next to each set of leadership attributes.
- For instance, you might see “strength” and “determination” for one of the leaders (whose name has been removed).
- Give yourself one score out of 10 for that combined pair of attributes.
- now as a team, write S for scrum master or P for product owner on each of the individual attributes.
- Each attribute may now have S, or P, or S+P or nothing.
- now see which row has the highest number of Ss, and which has the highest number of Ps.
- Mark these in some way.
- now the facilitator replaces the original leader names (this is why they were numbered).
- which leaders are going to be your scrum master and product owner?
- (This is just to get a laugh)
- which leaders do you personally have your highest scores against?
- Are you happy with that?
- Would you like to change your leadership style to emphasise other attributes?
- how many female leaders are there overall, out of the total number of leaders?
- (This is just an interesting statistic).
- which leaders are going to be your scrum master and product owner?
Meetups
Office Hours
- This is a great article suggesting the idea of an “office hours” meetup. The description of a dysfunctional meetup is unfair to most meetups I’ve ever attended, because they allow time for discussion after each talk and they often use a workshop style rather than a lecture format. But still I like the office-hours idea. For those that haven’t come across the concept (I hadn’t before I worked with a US-based company), it seems to be something commonly used in US universities, where lecturers will make themselves available at certain times of the day for students to knock on their door and get some one-to-one time.